Understandings:
- The characteristics of the pH curves produced by the different combinations of strong and weak acids and bases.
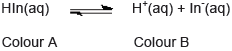
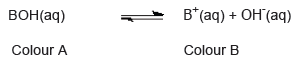
- An acid–base indicator is a weak acid or a weak base where the components of the conjugate acid–base pair have different colours.
- The relationship between the pH range of an acid–base indicator, which is a weak acid, and its pKa value.
- The buffer region on the pH curve represents the region where small additions of acid or base result in little or no change in pH.
- The composition and action of a buffer solution.
Applications and skills:
- The general shapes of graphs of pH against volume for titrations involving strong and weak acids and bases with an explanation of their important features.
- Selection of an appropriate indicator for a titration, given the equivalence point of the titration and the end point of the indicator.
- While the nature of the acid–base buffer always remains the same, buffer solutions can be prepared by either mixing a weak acid/base with a solution of a salt containing its conjugate, or by partial neutralization of a weak acid/base with a strong acid/base.
- Prediction of the relative pH of aqueous salt solutions formed by the different combinations of strong and weak acid and base.
|
Theory of knowledge:
- Is a pH curve an accurate description of reality or an artificial representation? Does science offer a representation of reality?
Utilization:
- Syllabus and cross-curricular links:
- Topic 5.1—thermometric/conductiometric titrations
- Topic 16.2—What are the unusual mathematical features of a pH curve? Students should also be familiar with the use of natural logs when using the Arrhenius expression in topic 16.2
Aims:
- Aim 6: Experiments could include investigation of pH curves, determination of the pKa of a weak acid, preparation and investigation of a buffer solution and the determination of the pKa of an indicator.
- Aim 7: Data logging, databases, spreadsheets and simulations can all be used. For example, the equivalence point could be determined by using a conductivity probe or a temperature probe.
|